
This is part five in the MASB Sponsorship Accountability series. Part 1 provides an overview of the current state of sponsorship use and management. Part 2 explores the long-term nature of sponsorship relationships and the resulting importance of fit between properties and brands. Part 3 establishes the importance of developing the business case for sponsorship as well as contractual considerations. Part 4 sets forth best practices in sponsorship stewardship and activation. In this fifth part, we examine the measurement of sponsorships. Request information on MASB
While W. Edwards Deming’s perspective on the purpose of measurement is apropos to sponsorship management, it certainly isn’t always easy to deploy. Several factors can complicate sponsorship measurement and hinder its ability to inform action:
The ANA (Association of National Advertisers), in collaboration with MASB (Marketing Accountability Standards Board), surveyed ANA members in 2018 to better understand current practices in sponsorship measurement. Among the key conclusions from the report:
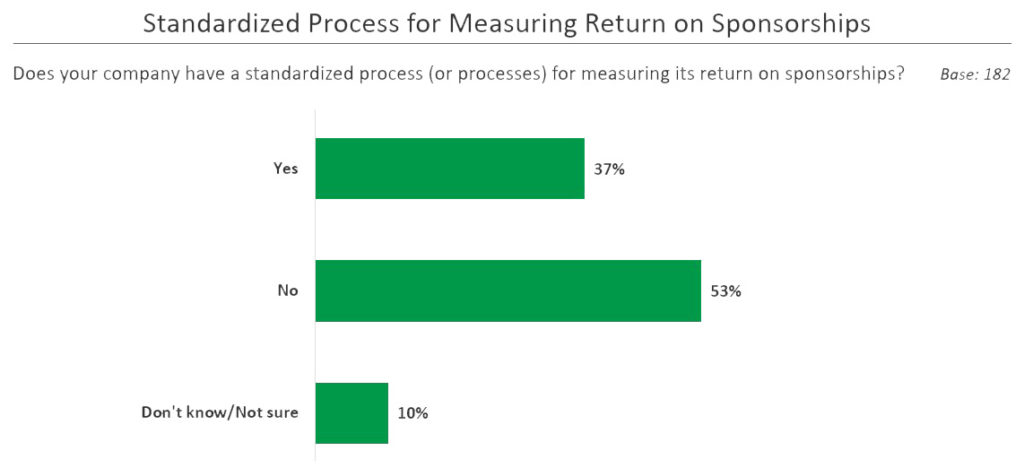
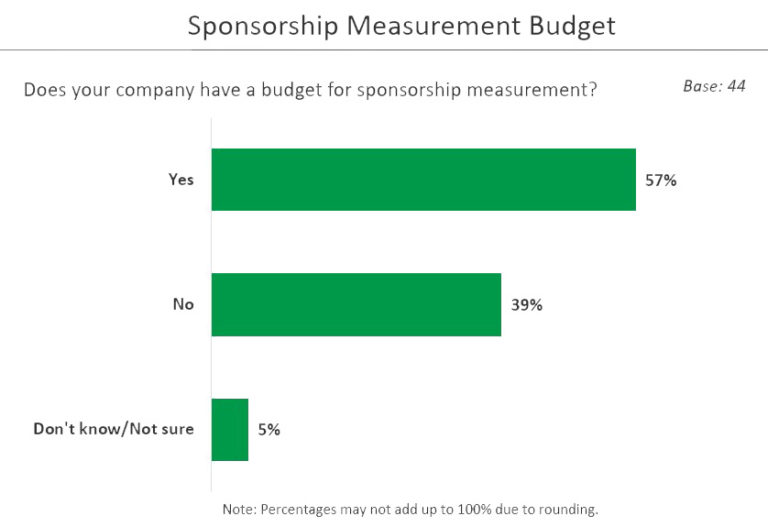
A key impediment to measuring sponsorship impact is a lack of budget. Just over half of the 37% with a standardized measurement process reported having a sponsorship measurement budget.[1] A best practice for measurement requires the budget be built into the overall sponsorship business case and protected through the lifecycle of the sponsorship, from contractual negotiations to stewardship, to activation. This means ensuring the measurement budget is actually deployed for measurement and not redirected towards activation.
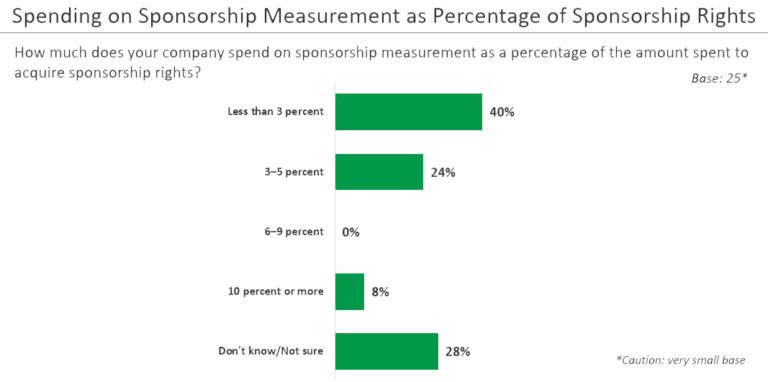
In practice, estimates of measurement budgets show they generally run less than 5% of sponsorship rights fees [1], thus having minimal impact on the business case. It is critical that a sufficient measurement budget be established. A level of 1% to 2% may be enough for brands with sizable sponsorship investments, while 5% or more may be necessary for smaller ones. If there are adjustments to activation along the way, a corresponding change to the budget must also be considered.
Key barriers to having a dedicated and sufficient measurement budget include (a) the discipline of budgeting not being a priority until recently; (b) having a portfolio with a variety of types of sponsorships/objectives; (c) lack of a well-defined overall sponsorship strategy; and (d) existing analytics methods not being up to the task. [1]
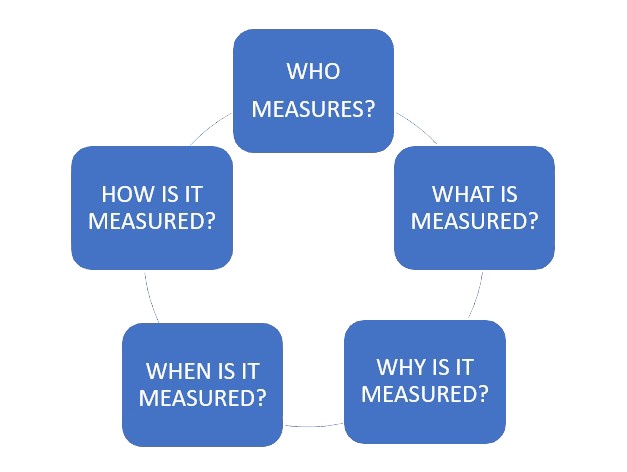
The figure below illustrates the five aspects of best-in-class measurement. Those five aspects are interdependent, and each one is critical for a successful measurement protocol.
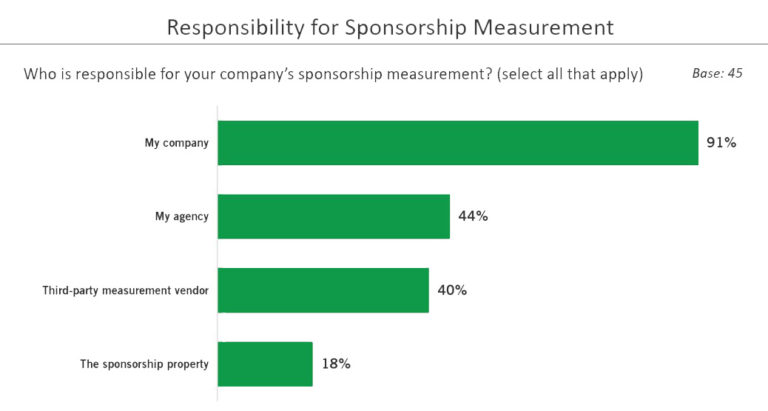
Nearly half of sponsors retain a third-party vendor to measure their sponsorships, a best practice when independent and reporting directly to the sponsor. One in five sponsors rely on the sponsored entity/property to evaluate the sponsorship, and 30% of respondents audit or verify metrics from the property.
Without independent verification, there is the potential for bias in results. At a minimum, skepticism, warranted or not, from internal teams concerned about the “fox guarding the henhouse” can occur. The ANA/MASB survey corroborated this, with 53% of respondents having concerns about non-transparent practices in sponsorship, further supporting the opportunity for better independent verification. [1] In addition to properties, agencies should not be charged with measuring activation tactics they have themselves developed and/or implemented.
Myriad metrics are in contention for inclusion in the sponsorship measurement protocol. Some will be germane to the tenets of the deal and therefore highly customized to a given brand. Other metrics can be considered standards for best practice. What is most important is not to confuse measures of effort and activity with those of impact. Measurement focused on metrics that matter facilitate the performance discussions necessary for improved accountability.
So, what metrics matter and how prevalent are their use? Below is an illustration of the sponsorship measurement maturity hierarchy, summarizing many of the prevalent metrics and practices.
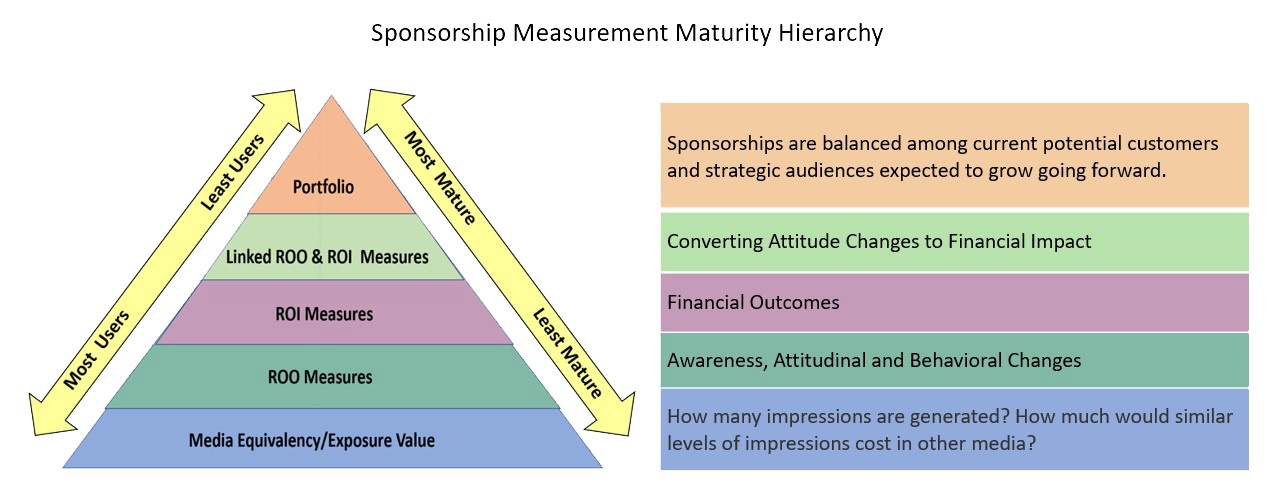
Media equivalency is the discipline of measuring the number of impressions generated by the sponsorship and comparing to the cost of similar levels of impressions from other marketing investments. It is one of multiple metrics often used in evaluating sponsorship performance. Though most prevalent and considered the “table stakes” of sponsorship measurement, media equivalency could still benefit from the application of greater rigor, as not all impressions are of equal value. There are many different measurement providers in the marketplace ranging from syndicated to custom methodologies. The general premise for media equivalency is to cross reference promoted engagements with earned media impressions and then assign a known value to that outcome.
A good example of applying more rigor to media equivalency comes from banking company BBVA USA. They have refined media equivalency by evaluating the return on individual media assets (ROA) of the sponsorships by assigning values and relevant KPIs to each asset. ROA is then calculated based on performance of the individual asset according to the preset KPIs.
Here’s the step-by-step process used by BBVA USA:
| STEPS | BBVA USA CASE STUDY: RETURN ON ASSETS CALCULATION Partnership Total Value: $100,000 Assets: Signage, Digital, Event and Tickets |
| 1 | Set KPIs for Signage = $50,000 KPI 1: Average attendance per season > 75% venue capacity KPI 2: Average TV Viewership > 80% of total market Set KPIs for Digital = $25,000 KPI 3: Impressions >= guaranteed impressions Set KPIs for Events = $15,000 KPI 4: Attendance > 50 people KPI 5: Earned Media Value > $50,000 Set KPIs for Tickets = $10,000 KPI 6: 100% Usage |
| 2 | Convert actual value of assets to 1,000-point scale Signage = ($50,000/$100,000)*1000 = 500 Available Points Digital = ($25,000/$100,000)*1000 = 250 Available Points Events = ($15,000/$100,000)*1000 = 150 Available Points Tickets = ($10,000/$100,000)*1000 = 100 Available Points |
| 3 | Assign Return on Assets based on activation performance (actual performance of the assets based on KPI) Signage: KPI 1: Actual average attendance was 80% venue capacity KPI 2: Actual TV Viewership was 90% of total market Digital: KPI 3: Actual impressions did not meet the guaranteed impressions Events: KPI 4: Attendance was greater than 50 people KPI 5: Earned Media Value was $100,000 Tickets: KPI 6: Usage was 100% and demand certainly exceeded supply |
| 4 | Return on Assets Calculation Signage = Performed well according to KPIs = 500 points Digital = Underperformed = 0 points Events = Performed very well = 150 points Tickets = Performed very well = 100 points Based on the point totals over 1000, this partnership has a ROA of 75%. |
Media equivalency should be considered one of the diagnostics in the sponsorship measurement tool suite, though it is insufficient by itself since it captures exposure, not impact.
“Based on the results, the most logical next step to optimize this partnership is to move away from the digital assets and assign that value to the events and tickets assets. This is a very simple example. You can imagine that with extensive partnership this calculation will get very tedious, but well worth it!”
At MASB, we consider return on objective (ROO) measures to be critical for sponsorship measurement. ROO measures are defined as a performance measure used to evaluate whether a marketing activity is achieving or exceeding the outcome of a desired marketing objective; ROO is focused on attitudinal and behavioral outcomes among consumers. Sometimes these are referred to as engagement or purchase funnel metrics.
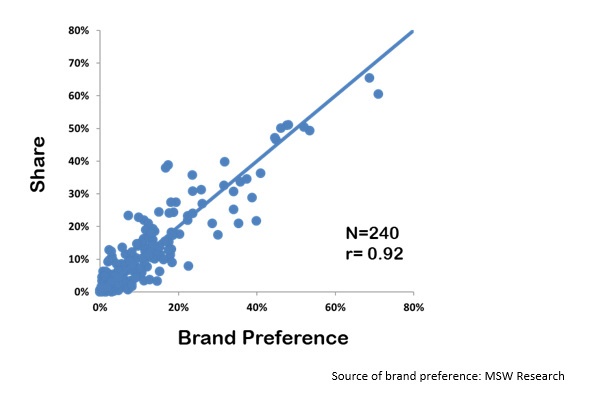
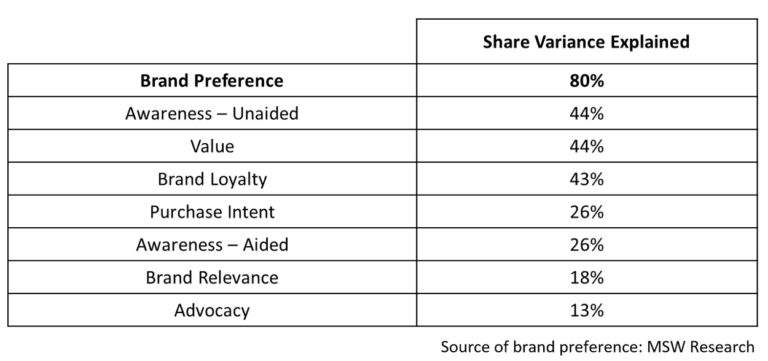
The highest order ROO metric for sponsorship is brand preference, due to its high correlation with market share and price premiums. Your brand may use a different type of brand equity metric that’s been validated to actual sales outcomes and this could be used as your ROO key performance indicator.
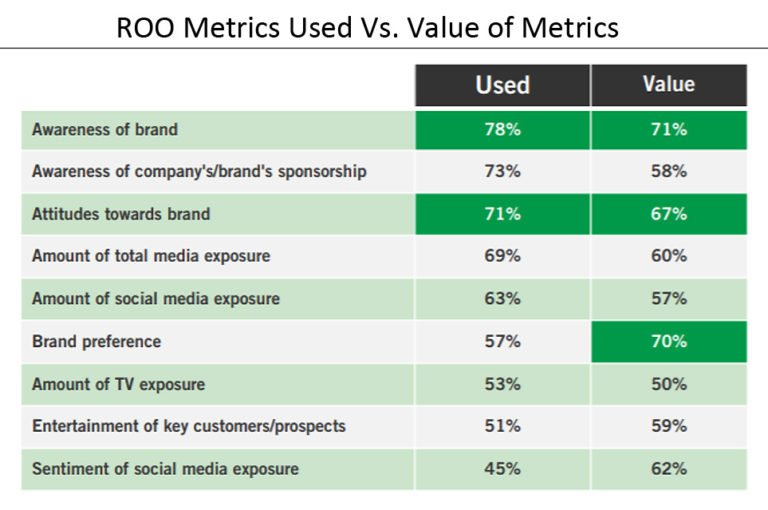
Examples of what we’d consider more diagnostic ROO metrics, and subordinate to brand preference, include attitudinal metrics such as brand awareness or sponsorship awareness, image ratings, likes or followers as these tend to have lower correlation to sales performance.
It is interesting that brand preference is perceived by over 70% of responding sponsors to be of high value but only 57% deploy it in their tool suite. [1]
As demonstrated in a MASB multi-year study of 200 brands [2], brand preference has three benefits over other ROO measures that are especially relevant for sponsorship measurement.
First, it has a compelling relationship to sales outcomes, both in terms of market share and sustaining price premiums [2][3]. These relationships were shown to hold across all categories examined (from CPG to automotive). This makes it a convenient and valuable metric to include in sponsorship lift studies as it enables the financial return on investment to be calculated.
Second, this relationship to sales is stronger than all other measures examined. Other measures tend to focus on a specific aspect of brand building; generating awareness, perceptions of value, loyalty, etc. Because of this narrowness these metrics are often not appropriate for specific campaigns.
For example, increasing brand awareness may be a key objective for campaigns targeting prospects unfamiliar with the brand yet it is much less important for campaigns focused on existing, long-term customers. In contrast, brand preference is not limited in this way and therefore is applicable regardless of the strategic objectives and the functional and image attributes being built between the sponsor and the property. This makes it the ideal metric for managing across a portfolio of brand sponsorships.
There is clearly an opportunity to deploy brand preference more prominently in sponsorship evaluations and the benefit of doing so is evident. For companies or brands with a portfolio of sponsorships, ROO may be the most viable metrics approach. It ties back to mid-funnel brand objectives and the strategic reason to enact the sponsorship in the first place.
One sponsorship measurement provider, SPONSORIUM, utilizes a customized set of criteria reflecting an individual brand’s objectives. For example, its clients may assign scores to metrics based on criteria such as: (1) alignment with corporate objectives; (2) inclusion of target consumer groups; (3) extendibility to relevant distribution channels, etc. A composite score for each sponsorship is calculated and plotted on a vertical axis and positioned along a horizontal axis based on the cost per point (impression). To obtain a cost per point, their platform divides the cost by the score. A cost of $500,000 divided by a score of 500 points equals $1,000 per point.
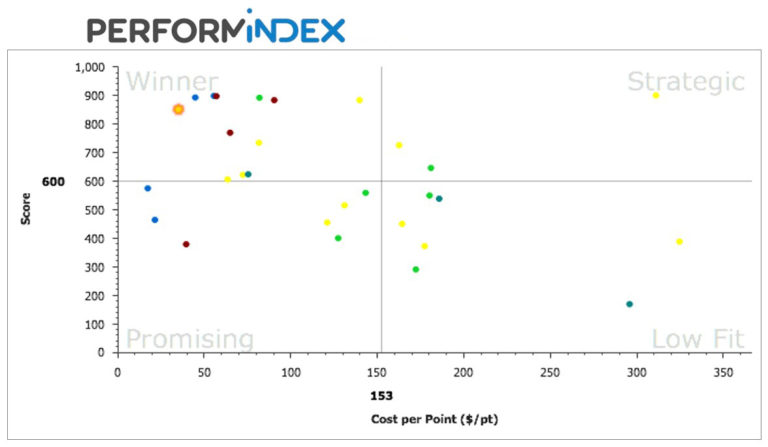
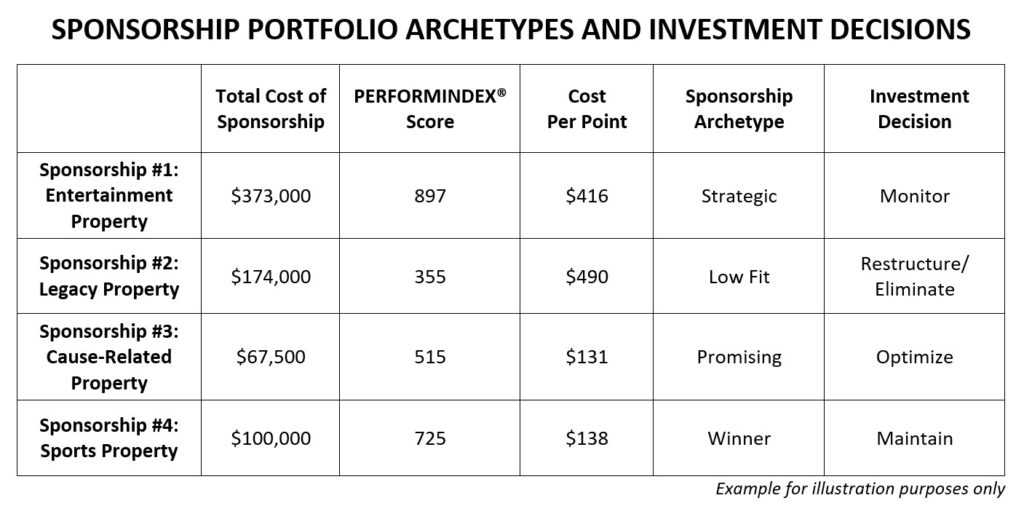
Management may then focus attention on those sponsorships placing in the lower right quadrant marked “low fit,” namely the most expensive and least impactful ones. Ways to improve overall value from the portfolio of sponsorships include optimizing activation or dropping the sponsorships outright at the next opportunity. In this manner, continuous year-over-year improvement of a company’s sponsorship discipline is enabled. See the figure below for how to make the right management decisions for a sponsorship depending on its archetype.
“Sponsors who have adopted a clear and consistent measurement benchmark can claim to be in total control over their investments. Whether a sponsoring corporation is looking to promote sales impact or media valuation (ROI) or to embrace community values, the ultimate goal will always be to achieve returns on its brand objectives (ROO). The results from developing weighted KPIs for 300 brands worldwide supports MASB’s call to establish the linkages between ROO and ROI.”
Financial attribution is the ultimate goal for measurement but it can be elusive depending on the type of sponsorship and industry sector. The Common Language Marketing Dictionary defines ROI (%) as Net profit ($) ÷ Investment ($) x 100 %. The premise of ROI here is to measure the net financial outcome attributable to the sponsorship and then use it to drive business decisions. While return-on-investment feels ‘objective’ and finite on its face, it’s important not to mis- or overinterpret it. For the ROI to be valid, it must be due to a stated brand objective. If it’s mere financial return without evidence of being caused by a marketing activity aligned with the brand’s objective, it should not be included as ROI.
Many brands, which use ROI in their suite of KPIs, monitor financial contribution in addition to return in their effort to quantify how the sponsorship contributes to sales volume. This is helpful for comparisons to other marketing initiatives. If a sponsorship is contributing a high amount of sales volume but not returning investment, it would be detrimental to the topline to divest. Brands may take the route of trying to drive more efficiency into the sponsorship instead of divesting outright.
The sponsorship ROI should also be contextualized with the rest of the marketing investment bundle. If it is the case that the sponsorship has a slight negative return on investment, but some other marketing initiative has a greater degree of negative ROI, it would make sense to work on improving the other marketing initiative first before doing anything with the sponsorship.
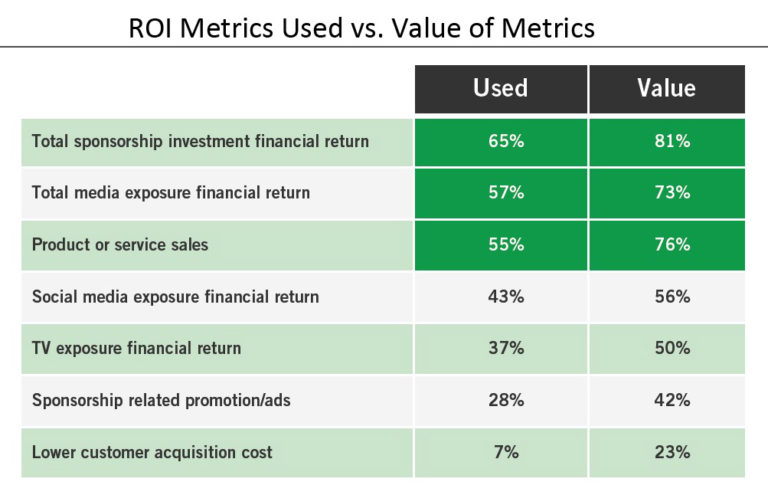
Overall utilization of ROI metrics runs lower than for ROO metrics [1] but it’s not for lack of desire. We see a notable disconnect between perceived value and utilization in three different metrics: (1) total sponsorship investment financial return; (2) total media exposure financial return; and (3) product or service sales.
It’s virtually impossible to optimize the impact of sponsorship without comprehending what impact it has on consumers. As noted above, ROO measures capture consumer impact, though ROI measures do not. This is why it is critical to link ROO measures to ROI. Given the relationship between brand preference and market share, it is fairly easy to translate the financial value associated with an improvement in brand preference and resultant sales. While possible, it is more difficult, to isolate and quantify the value of a change in other ROO measures such as awareness, imagery or purchase intent.
There are multiple ways to isolate the impact that sponsorship has on consumers. The most often used methodology is research based on test vs. control or exposed vs. non-exposed audiences. However, these methodologies require careful “matched sampling” criteria to insure there are not demographic, psychographic, intent or experience differences between the audiences being compared. Solely measuring lift at an on-site activation can produce artificial results since the research “leads” the respondent, as attendees know what is expected in terms of a response. Therefore, measurement over time is required to determine the sustainability of any difference associated with the sponsorship.
MASB is unaware of published norms for either sponsorship ROO or ROI, due largely to the differing objectives of each brand and its sponsorship portfolio. Therefore, each company or brand is left with devising its own measurement suite creating benchmarks based on proprietary, empirical datasets.
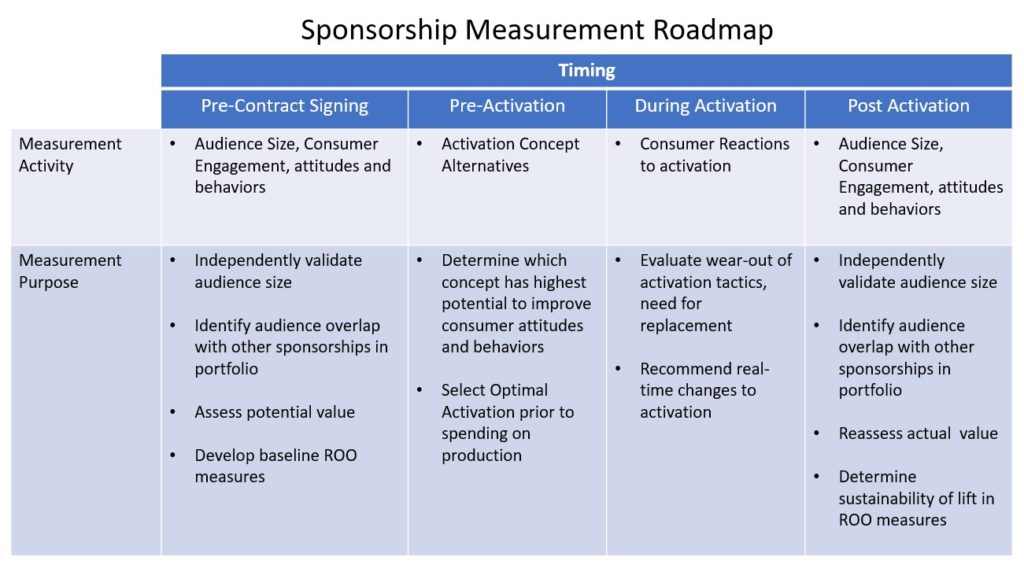
To protect the sponsorship investment, the measurement plan must align with the sponsorship strategy. This enables it to inform throughout the entire process; negotiations, renewal, activation, valuation and provides a consistent reference for the people that work on each of the stages. Measurement should occur before, during and after a sponsorship has occurred.
The measurement roadmap below summarizes the activity and purpose of measurement at each stage of the sponsorship lifecycle.
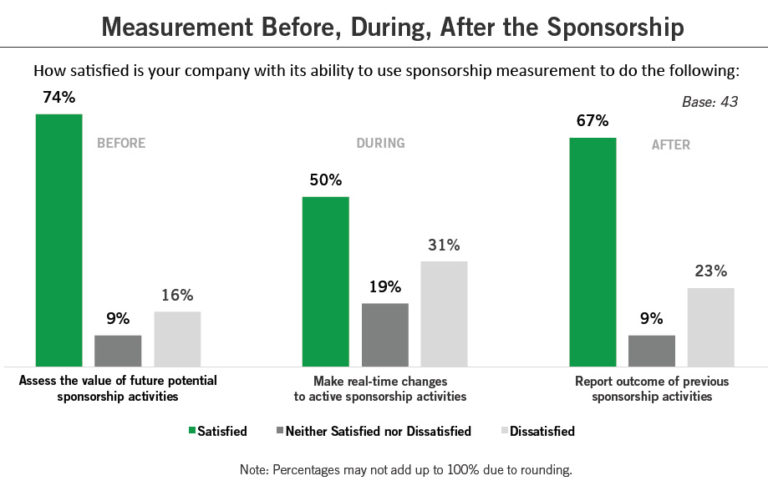
Among marketers measuring sponsorship, satisfaction is highest with pre and post measurement. [1] Only half of marketers were satisfied with measurement during the sponsorship; an opportunity for improvement.
In addition to frequent measurement over the lifecycle of a sponsorship, marketers should strive to move up the sponsorship measurement maturity hierarchy by incorporating the recommendations below.
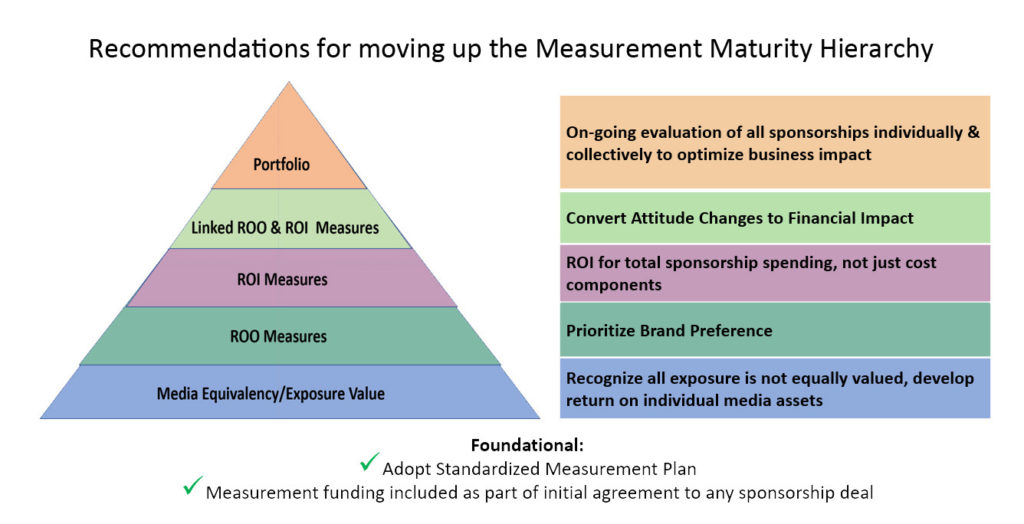
The highest level of maturity is collectively managing all sponsorships for the company. While each sponsorship should be evaluated individually for its fit and effectiveness, it should also be reviewed in the context of the other sponsorships. Even sponsorships which are on strategy and well activated can be duplicative with others and therefore be less impactful. Sponsorships must fit together like jigsaw puzzle pieces, building on each other to advance an overall image among consumers. The best portfolios can lead to a synergistic situation where the impact of each individual portion is enhanced.
Three aspects should be examined in a portfolio review. The first is audience reach, that is, how the sponsorships work together to reach the various key marketing target groups. Ideally each of these target groups should receive “touches” by the portfolio while no target should receive so many that they face diminishing returns. To begin the process, this can be as easy as creating a table listing each sponsorship and putting a checkmark for each target it reaches in a substantial and meaningful way. This will clearly show which segments are potentially being under or over served and inform a discussion on how to optimize the audience breadth of the portfolio. Such exercises often do not result in the elimination of sponsorships but rather shift allocations between them or the activation tactics with them.
The second aspect is longevity. As sponsorships continue, the brand-property ties can strengthen enabling easier transference of the property’s equity to the brand. This is highly desirable and therefore it is wise to have a bias whereas the majority, perhaps up to ninety percent, of the portfolio should be made up of such mature relationships. However, properties themselves have lifecycles where their reach and strength with audiences rise and ebb. Diversification of the portfolio across multiple properties protects against the decline of any one property in the short term.
The third aspect is opportunity. While the bulk of the portfolio is typically best served through mature property relationships and proven activation opportunities, a portion, perhaps ten percent, should be set aside for experimenting with new opportunities. This can include new, unproven ways to activate existing sponsorships but it should also include new sponsorships.
The purpose of experimenting with new sponsorships is two-fold. One is to help the company’s brands remain culturally relevant by being involved at the ground-level of contemporary trends. This is especially important in supporting marketing efforts to pass brand equity from one generation to the next.
The second reason is to deny competitors from gaining easy footholds on which to co-opt the brand’s position. While revolutionary trends with the potential to overthrow brand positions are rare, they do happen and management should be prepared for it. Sponsorship of eSports teams and leagues is an example of such an experimental opportunity which has yielded very positive results for brands.
Review of the sponsorship portfolio is best implemented as part of the annual brand planning process. Not only does this help ensure sponsorship activation and measurement budgets are appropriately included with those for other marketing expenditures, it fosters identification of catalyst opportunities where the sponsorships can enhance other types of marketing.
During this process, a three-year view of sponsorship should be considered. This should include which areas to increase/decrease/shift and opportunities to pursue. The three-year view provides time for the different marketing teams involved to coordinate with other corporate functions. This includes legal to develop contracts and protect related intellectual property, operations to prepare for implementation of packaging and distribution activations, and finance to engage on ROI calculations.
This article concludes the core material of the MASB Sponsorship Accountability Series. However, we encourage you to submit additional feedback and questions. These can be addressed in additional installments and in the combined practitioner paper which will provide expanded information beyond what was included in these individual articles.
Also, we recognize that the sponsorship space will keep evolving as more and more dollars are invested in sponsorships every year. Towards this end, we are actively developing a best practices benchmark tool to independently assess any marketer’s sponsorship approach. This will be fueled by a meta-analysis across differing sponsorships with varied ROO and ROI measures. If you are a marketer or measurement provider interested in participating, please contact us, info@themasb.org.
Please bookmark themasb.org for follow-ups and other articles illuminating the exciting intersection of marketing and finance, what we at MASB call Marketing Accountability.